JVM自带命令

引用自jvm系列(四):jvm调优-命令篇

运用jvm自带的命令可以方便的在生产监控和打印堆栈的日志信息帮忙我们来定位问题!虽然jvm调优成熟的工具已经有很多:jconsole、大名鼎鼎的VisualVM,IBM的Memory Analyzer等等,但是在生产环境出现问题的时候,一方面工具的使用会有所限制,另一方面喜欢装X的我们,总喜欢在出现问题的时候在终端输入一些命令来解决。所有的工具几乎都是依赖于jdk的接口和底层的这些命令,研究这些命令的使用也让我们更能了解jvm构成和特性。

Sun JDK监控和故障处理命令有jps jstat jmap jhat jstack jinfo

jps

JVM Process Status Tool,显示指定系统内所有的HotSpot虚拟机进程。

  • 命令格式

jps [option] [hostid]

  • option参数

    • -l:输出主类全名或jar路径
    • -q:只输出LVMID
    • -m:输入JVM启动时传递给main()的参数
    • -v:输出JVM启动时显示指定的JVM参数

其中[option]、[hostid]参数也可以不写。

  • 示例
1
2
3
4
$ jps -l -m
28920 org.apache.catalina.startup.Boostrap start
11589 org.apache.catalina.startup.Boostrap start
25816 sun.tools.jps.Jps -l -m

jstat

jstat(JVM statistics Monitoring)是用于监视虚拟机运行时状态信息的命令,它可以显示出虚拟机进程中的类装载、内存、垃圾收集、JIT编译等运行数据。

  • 命令格式

jstat [option] LVMID [interval] [count]

  • 参数

    • [option]:操作参数
    • LVMID:本地虚拟机进程ID
    • [interval]:连续输出的时间间隔
    • [count]:连续输出的次数

option参数总览:

option参数 说明
class class loader的行为统计。Statistics on the behavior of the class loader.
compiler HotSpt JIT编译器行为统计。Statistics of the behavior of the HotSpot Just-in-Time compiler.
gc 垃圾回收堆的行为统计。Statistics of the behavior of the garbage collected heap.
gccapacity 各个垃圾回收代容量(young,old,perm)和他们相应的空间统计。Statistics of the capacities of the generations and their corresponding spaces.
gcutil 垃圾回收统计概述。Summary of garbage collection statistics.
gccause 垃圾收集统计概述(同-gcutil),附加最近两次垃圾回收事件的原因。Summary of garbage collection statistics (same as -gcutil), with the cause of the last and
gcnew 新生代行为统计。Statistics of the behavior of the new generation.
gcnewcapacity 新生代与其相应的内存空间的统计。Statistics of the sizes of the new generations and its corresponding spaces.
gcold 年老代和永生代行为统计。Statistics of the behavior of the old and permanent generations.
gcoldcapacity 年老代行为统计。Statistics of the sizes of the old generation.
gcpermcapacity 永生代行为统计。Statistics of the sizes of the permanent generation.
printcompilation HotSpot编译方法统计。HotSpot compilation method statistics.

option参数详解:

-class

监视类装载、卸载数量、总空间以及耗费的时间

1
2
3
λ jstat -class 10916
Loaded Bytes Unloaded Bytes Time
46635 93465.9 1478 2023.5 198.16
  • Loaded:加载class的数量
  • Bytes:class字节大小
  • Unloaded:未加载class的数量
  • Bytes:未加载class的字节大小
  • Time:加载时间

-compiler

输出JIT编译过的方法数量耗时等

1
2
3
λ jstat -compiler 10916                                 
Compiled Failed Invalid Time FailedType FailedMethod
56988 0 0 304.35 0
  • Compiled : 编译数量
  • Failed : 编译失败数量
  • Invalid : 无效数量
  • Time : 编译耗时
  • FailedType : 失败类型
  • FailedMethod : 失败方法的全限定名

-gc

垃圾回收堆的行为统计,常用命令

1
2
3
λ jstat -gc 10916
S0C S1C S0U S1U EC EU OC OU MC MU CCSC CCSU YGC YGCT FGC FGCT GCT
10496.0 10496.0 0.0 1085.4 84032.0 7301.1 209904.0 106957.6 287520.0 267661.8 36752.0 32831.8 649 3.923 31 4.348 8.271

C即Capacity 总容量,U即Used 已使用的容量

  • S0C : survivor0区的总容量
  • S1C : survivor1区的总容量
  • S0U : survivor0区已使用的容量
  • S1C : survivor1区已使用的容量
  • EC : Eden区的总容量
  • EU : Eden区已使用的容量
  • OC : Old区的总容量
  • OU : Old区已使用的容量
  • PC 当前perm的容量 (KB)
  • PU perm的使用 (KB)
  • YGC : 新生代垃圾回收次数
  • YGCT : 新生代垃圾回收时间
  • FGC : 老年代垃圾回收次数
  • FGCT : 老年代垃圾回收时间
  • GCT : 垃圾回收总消耗时间

λ jstat -gc 10916 2000 20

这个命令的意思是每隔2000ms输出10916的gc情况,一共输出20次。

-gccapacity

同-gc,不过还会输出Java堆各区域使用到的最大、最小空间

1
2
3
λ jstat -gccapacity 10916
NGCMN NGCMX NGC S0C S1C EC OGCMN OGCMX OGC OC MCMN MCMX MC CCSMN CCSMX CCSC YGC FGC
43648.0 256000.0 105024.0 10496.0 10496.0 84032.0 87424.0 512000.0 209904.0 209904.0 0.0 1300480.0 287520.0 0.0 1048576.0 36752.0 649 32
  • NGCMN : 新生代占用的最小空间
  • NGCMX : 新生代占用的最大空间
  • OGCMN : 老年代占用的最小空间
  • OGCMX : 老年代占用的最大空间
  • OGC:当前年老代的容量 (KB)
  • OC:当前年老代的空间 (KB)
  • PGCMN : perm占用的最小空间
  • PGCMX : perm占用的最大空间

-gcutil

同-gc,不过输出的是已使用空间占总空间的百分比

1
2
3
λ jstat -gcutil 10916
S0 S1 E O M CCS YGC YGCT FGC FGCT GCT
0.00 0.00 4.68 47.68 93.00 89.22 649 3.923 32 5.690 9.613

-gccause

垃圾收集统计概述(同-gcutil),附加最近两次垃圾回收事件的原因

1
2
3
λ jstat -gccause 10916
S0 S1 E O M CCS YGC YGCT FGC FGCT GCT LGCC GCC
0.00 0.00 5.42 47.68 93.00 89.22 649 3.923 32 5.690 9.613 System.gc() No GC
  • LGCC:最近垃圾回收的原因
  • GCC:当前垃圾回收的原因

-gcnew

统计新生代的行为

1
2
3
λ jstat -gcnew 10916
S0C S1C S0U S1U TT MTT DSS EC EU YGC YGCT
10496.0 10496.0 0.0 0.0 6 6 5248.0 84032.0 6334.3 649 3.923
  • TT:Tenuring threshold(提升阈值)
  • MTT:最大的tenuring threshold
  • DSS:survivor区域大小 (KB)

-gcnewcapacity

新生代与其相应的内存空间的统计

1
2
3
λ jstat -gcnewcapacity 10916
NGCMN NGCMX NGC S0CMX S0C S1CMX S1C ECMX EC YGC FGC
43648.0 256000.0 105024.0 25600.0 10496.0 25600.0 10496.0 204800.0 84032.0 649 32
  • NGC:当前年轻代的容量 (KB)
  • S0CMX:最大的S0空间 (KB)
  • S0C:当前S0空间 (KB)
  • ECMX:最大eden空间 (KB)
  • EC:当前eden空间 (KB)

-gcold

统计旧生代的行为

1
2
3
λ jstat -gcold 10916
MC MU CCSC CCSU OC OU YGC FGC FGCT GCT
287520.0 267405.4 36752.0 32789.2 209904.0 100087.0 649 32 5.690 9.613

-gcoldcapacity

统计旧生代的大小和空间

1
2
3
λ jstat -gcoldcapacity 10916
OGCMN OGCMX OGC OC YGC FGC FGCT GCT
87424.0 512000.0 209904.0 209904.0 649 32 5.690 9.613

-gcpermcapacity

永生代行为统计

1
2
3
λ jstat -gcpermcapacity 10916
PGCMN PGCMX PGC PC YGC FGC FGCT GCT
87424.0 512000.0 209904.0 209904.0 649 32 5.690 9.613

-printcompilation

hotspot编译方法统计

1
2
3
λ jstat -printcompilation 10916
Compiled Size Type Method
56991 24 1 com/intellij/ide/b/a$$Lambda$1343 run
  • Compiled:被执行的编译任务的数量
  • Size:方法字节码的字节数
  • Type:编译类型
  • Method:编译方法的类名和方法名。类名使用”/“ 代替 “.” 作为空间分隔符. 方法名是给出类的方法名. 格式是一致于HotSpot - XX:+PrintComplation 选项

jmap

jmap(JVM Memory Map)命令用于生成heap dump文件,如果不使用这个命令,还阔以使用-XX:+HeapDumpOnOutOfMemoryError参数来让虚拟机出现OOM的时候·自动生成dump文件。 jmap不仅能生成dump文件,还阔以查询finalize执行队列、Java堆和永久代的详细信息,如当前使用率、当前使用的是哪种收集器等。

  • 命令格式

jmap [option] LVMID

  • option参数

    • dump:生成堆转储快照
    • finalizerinfo:显示在F-Queue队列等待Finalizer线程执行finalizer方法的对象
    • heap:显示Java堆详细信息
    • histo:显示堆中对象的统计信息
    • permstat:to print permanent generation statistics
    • F:当-dump没有响应时,强制生成dump快照
  • 示例

-dump

常用格式

-dump:live,format=b,file=<filename> pid

dump堆到文件,format指定输出格式,live指明是活着的对象,file指定文件名

1
2
3
λ jmap -dump:live,format=b,file=dump.hprof 10916
Dumping heap to C:\Users\yupaits\Desktop\dump.hprof ...
Heap dump file created

dump.hprof这个后缀是为了后续可以直接用MAT(Memory Anlysis Tool)打开。

-finalizerinfo

打印等待回收对象的信息

1
2
3
4
5
6
λ jmap -finalizerinfo 7924
Attaching to process ID 7924, please wait...
Debugger attached successfully.
Server compiler detected.
JVM version is 25.131-b11
Number of objects pending for finalization: 0

可以看到当前F-QUEUE队列中并没有等待Finalizer线程执行finalizer方法的对象。

-heap

打印heap的概要信息,GC使用的算法,heap的配置及wise heap的使用情况,可以用此来判断内存目前的使用情况以及垃圾回收情况

1
2
3
4
5
6
7
8
9
10
11
12
13
14
15
16
17
18
19
20
21
22
23
24
25
26
27
28
29
30
31
32
33
34
35
36
37
38
39
40
41
42
43
44
45
46
47
λ jmap -heap 7924
Attaching to process ID 7924, please wait...
Debugger attached successfully.
Server compiler detected.
JVM version is 25.131-b11

using thread-local object allocation.
Parallel GC with 4 thread(s)

Heap Configuration:
MinHeapFreeRatio = 0
MaxHeapFreeRatio = 100
MaxHeapSize = 2122317824 (2024.0MB)
NewSize = 44564480 (42.5MB)
MaxNewSize = 707264512 (674.5MB)
OldSize = 89653248 (85.5MB)
NewRatio = 2
SurvivorRatio = 8
MetaspaceSize = 21807104 (20.796875MB)
CompressedClassSpaceSize = 1073741824 (1024.0MB)
MaxMetaspaceSize = 17592186044415 MB
G1HeapRegionSize = 0 (0.0MB)

Heap Usage:
PS Young Generation
Eden Space:
capacity = 274202624 (261.5MB)
used = 162248416 (154.73214721679688MB)
free = 111954208 (106.76785278320312MB)
59.170993199539915% used
From Space:
capacity = 15204352 (14.5MB)
used = 7543256 (7.193809509277344MB)
free = 7661096 (7.306190490722656MB)
49.61247937432651% used
To Space:
capacity = 14680064 (14.0MB)
used = 0 (0.0MB)
free = 14680064 (14.0MB)
0.0% used
PS Old Generation
capacity = 88080384 (84.0MB)
used = 28832816 (27.497116088867188MB)
free = 59247568 (56.50288391113281MB)
32.73466201055618% used

27680 interned Strings occupying 2923128 bytes.

可以很清楚的看到Java堆中各个区域目前的情况。

-histo

打印堆的对象统计,包括对象数、内存大小等等 (因为在dump:live前会进行full gc,如果带上live则只统计活对象,因此不加live的堆大小要大于加live堆的大小 )

1
2
3
4
5
6
7
8
9
10
11
12
13
14
15
16
17
18
19
20
21
22
23
24
25
26
27
28
29
30
31
32
33
34
35
36
37
38
39
40
41
42
43
44
λ jmap -histo:live 7924 | more

num #instances #bytes class name
----------------------------------------------
1: 65728 8006256 [C
2: 8084 5736200 [B
3: 25807 2271016 java.lang.reflect.Method
4: 65064 1561536 java.lang.String
5: 46033 1473056 java.util.concurrent.ConcurrentHashMap$Node
6: 11598 1297352 java.lang.Class
7: 14291 713424 [Ljava.lang.Object;
8: 19932 637824 java.lang.ref.WeakReference
9: 15339 613560 java.util.LinkedHashMap$Entry
10: 9517 532952 java.util.LinkedHashMap
11: 7114 519968 [Ljava.util.HashMap$Node;
12: 10058 482784 org.aspectj.weaver.reflect.ShadowMatchImpl
13: 13992 447744 java.util.HashMap$Node
14: 334 399584 [Ljava.util.concurrent.ConcurrentHashMap$Node;
15: 4818 361648 [I
16: 20911 334576 java.lang.Object
17: 10058 321856 org.aspectj.weaver.patterns.ExposedState
18: 8037 321480 java.lang.ref.SoftReference
19: 13026 282824 [Ljava.lang.Class;
20: 9821 235704 java.beans.MethodRef
21: 9613 230712 java.util.ArrayList
22: 7236 196224 [Ljava.lang.String;
23: 3475 194600 java.beans.MethodDescriptor
24: 5495 175840 java.util.LinkedList
25: 7193 172632 org.springframework.core.MethodClassKey
26: 1420 136320 org.springframework.beans.GenericTypeAwarePropertyDescriptor
27: 1751 126072 java.beans.PropertyDescriptor
28: 2933 117320 java.util.WeakHashMap$Entry
29: 2299 110352 java.util.HashMap
30: 2553 102120 java.lang.ref.Finalizer
31: 3966 95184 sun.reflect.generics.tree.SimpleClassTypeSignature
32: 3781 90744 java.util.LinkedList$Node
33: 2246 89840 java.util.TreeMap$Entry
34: 112 88616 [J
35: 1046 83680 java.lang.reflect.Constructor
36: 3308 75096 [Ljava.lang.reflect.Type;
37: 3966 74696 [Lsun.reflect.generics.tree.TypeArgument;
38: 2135 68320 java.util.Hashtable$Entry
39: 4202 67232 java.util.LinkedHashSet
-- More --

仅仅打印了前10行

xml class name是对象类型,说明如下:

1
2
3
4
5
6
7
8
9
B byte
C char
D double
F float
I int
J long
Z boolean
[ 数组,如[I 表示int[]
[L+类名 其它对象

-permstat(使用jdk8时发现已经换成了-clstats)

打印Java堆内存的永久保存区域的类加载器的智能统计信息。对于每个类加载器而言,它的名称、活跃度、地址、父类加载器、它所加载的类的数量和大小都会被打印。此外,包含的字符串数量和大小也会被打印。

1
2
3
4
5
6
7
8
9
10
11
12
13
14
15
16
17
18
19
20
21
22
23
24
25
26
27
28
29
30
31
32
33
34
35
36
37
38
39
40
41
42
43
44
45
46
47
48
49
50
51
52
53
54
55
56
57
58
59
60
61
62
63
64
65
66
67
68
69
70
71
72
73
74
75
76
77
78
79
80
81
82
λ jmap -clstats 7924
Attaching to process ID 7924, please wait...
Debugger attached successfully.
Server compiler detected.
JVM version is 25.131-b11
finding class loader instances ..done.
computing per loader stat ..done.
please wait.. computing liveness.............................................................liveness analysis may be inaccurate ...
class_loader classes bytes parent_loader alive? type

<bootstrap> 2587 4530544 null live <internal>
0x0000000082ab0428 1 880 0x00000000818d03c8 dead sun/reflect/DelegatingClassLoader@0x0000000100009df8
0x0000000081bca4b8 1 880 null dead sun/reflect/DelegatingClassLoader@0x0000000100009df8
0x0000000082d43550 0 0 0x00000000818d03c8 live org/springframework/data/convert/ClassGeneratingEntityInstantiator$ObjectInstantiatorClassGenerator$ByteArrayClassLoader@0x0000000100666650
0x0000000083151310 9 32078 0x00000000818d03c8 dead sun/reflect/misc/MethodUtil@0x0000000100639208
0x00000000819f1418 1 880 null dead sun/reflect/DelegatingClassLoader@0x0000000100009df8
0x0000000081bcaa30 1 880 0x00000000818d03c8 dead sun/reflect/DelegatingClassLoader@0x0000000100009df8
0x00000000827cf870 1 892 null dead sun/reflect/DelegatingClassLoader@0x0000000100009df8
0x0000000081e5fbe8 1 880 0x00000000818d03c8 dead sun/reflect/DelegatingClassLoader@0x0000000100009df8
0x00000000821d2810 1 880 0x00000000818d03c8 dead sun/reflect/DelegatingClassLoader@0x0000000100009df8
0x0000000083151e18 1 1471 0x00000000818d03c8 dead sun/reflect/DelegatingClassLoader@0x0000000100009df8
0x000000008217a418 14 23439 null live org/hibernate/boot/registry/classloading/internal/ClassLoaderServiceImpl$AggregatedClassLoader@0x000000010041de20
0x0000000082a9df38 1 1471 0x00000000818d03c8 dead sun/reflect/DelegatingClassLoader@0x0000000100009df8
0x0000000082ab05b8 1 880 0x00000000818d03c8 dead sun/reflect/DelegatingClassLoader@0x0000000100009df8
0x0000000082eda7f8 1 880 null dead sun/reflect/DelegatingClassLoader@0x0000000100009df8
0x0000000083152200 1 880 null dead sun/reflect/DelegatingClassLoader@0x0000000100009df8
0x00000000821fed88 0 0 0x00000000818d03c8 live java/net/URLClassLoader@0x000000010000ecd0
0x0000000081bca8a0 1 880 0x00000000818d03c8 dead sun/reflect/DelegatingClassLoader@0x0000000100009df8
0x00000000827cf6e0 1 1474 0x00000000818d03c8 dead sun/reflect/DelegatingClassLoader@0x0000000100009df8
0x00000000821d2600 1 1472 0x00000000818d03c8 dead sun/reflect/DelegatingClassLoader@0x0000000100009df8
0x0000000083151c88 1 1473 0x00000000818d03c8 dead sun/reflect/DelegatingClassLoader@0x0000000100009df8
0x0000000081bcae18 1 880 0x00000000818d03c8 dead sun/reflect/DelegatingClassLoader@0x0000000100009df8
0x00000000818d0428 114 264124 null live sun/misc/Launcher$ExtClassLoader@0x000000010000fa48
0x0000000083151a30 1 1473 0x00000000818d03c8 dead sun/reflect/DelegatingClassLoader@0x0000000100009df8
0x0000000082a9e000 1 1471 0x00000000818d03c8 dead sun/reflect/DelegatingClassLoader@0x0000000100009df8
0x000000008183d228 0 0 0x00000000818d03c8 live java/util/ResourceBundle$RBClassLoader@0x00000001000f4b10
0x0000000081bca710 1 880 0x00000000818d03c8 dead sun/reflect/DelegatingClassLoader@0x0000000100009df8
0x0000000083152138 1 881 0x00000000818d03c8 dead sun/reflect/DelegatingClassLoader@0x0000000100009df8
0x00000000831e52b0 1 889 0x0000000083151310 dead sun/reflect/DelegatingClassLoader@0x0000000100009df8
0x0000000081bcac88 1 880 0x00000000818d03c8 dead sun/reflect/DelegatingClassLoader@0x0000000100009df8
0x0000000082a9e190 1 1474 0x00000000818d03c8 dead sun/reflect/DelegatingClassLoader@0x0000000100009df8
0x0000000081bca580 1 880 0x00000000818d03c8 dead sun/reflect/DelegatingClassLoader@0x0000000100009df8
0x00000000818dafb0 2 4839 null dead javax/management/remote/rmi/NoCallStackClassLoader@0x00000001000df370
0x0000000081e5fa58 1 880 0x00000000818d03c8 dead sun/reflect/DelegatingClassLoader@0x0000000100009df8
0x00000000821d29a0 1 1471 0x00000000818d03c8 dead sun/reflect/DelegatingClassLoader@0x0000000100009df8
0x0000000083151fa8 1 880 0x00000000818d03c8 dead sun/reflect/DelegatingClassLoader@0x0000000100009df8
0x00000000831e5120 1 881 0x00000000818d03c8 dead sun/reflect/DelegatingClassLoader@0x0000000100009df8
0x0000000081bcaaf8 1 880 0x00000000818d03c8 dead sun/reflect/DelegatingClassLoader@0x0000000100009df8
0x00000000827cf938 1 880 null dead sun/reflect/DelegatingClassLoader@0x0000000100009df8
0x00000000818d03c8 8438 14146250 0x00000000818d0428 live sun/misc/Launcher$AppClassLoader@0x000000010000f6a0
0x00000000818dbcc8 3 2774 null dead javax/management/remote/rmi/NoCallStackClassLoader@0x00000001000df370
0x0000000081e5fb20 1 880 0x00000000818d03c8 dead sun/reflect/DelegatingClassLoader@0x0000000100009df8
0x00000000821d28d8 1 880 0x00000000818d03c8 dead sun/reflect/DelegatingClassLoader@0x0000000100009df8
0x0000000083151d50 1 1471 0x00000000818d03c8 dead sun/reflect/DelegatingClassLoader@0x0000000100009df8
0x0000000082ab0360 1 1473 0x00000000818d03c8 dead sun/reflect/DelegatingClassLoader@0x0000000100009df8
0x0000000081bca3f0 1 880 null dead sun/reflect/DelegatingClassLoader@0x0000000100009df8
0x00000000819f1350 1 880 null dead sun/reflect/DelegatingClassLoader@0x0000000100009df8
0x0000000081bca968 1 880 0x00000000818d03c8 dead sun/reflect/DelegatingClassLoader@0x0000000100009df8
0x00000000827cf7a8 1 1485 0x00000000818d03c8 dead sun/reflect/DelegatingClassLoader@0x0000000100009df8
0x0000000081e5fcb0 1 880 0x00000000818d03c8 dead sun/reflect/DelegatingClassLoader@0x0000000100009df8
0x00000000821d2748 1 880 0x00000000818d03c8 dead sun/reflect/DelegatingClassLoader@0x0000000100009df8
0x0000000083151bc0 1 1473 0x00000000818d03c8 dead sun/reflect/DelegatingClassLoader@0x0000000100009df8
0x0000000082a9de70 1 880 0x00000000818d03c8 dead sun/reflect/DelegatingClassLoader@0x0000000100009df8
0x0000000082ab04f0 1 880 0x00000000818d03c8 dead sun/reflect/DelegatingClassLoader@0x0000000100009df8
0x0000000081bcaee0 1 880 0x00000000818d03c8 dead sun/reflect/DelegatingClassLoader@0x0000000100009df8
0x00000000831522c8 1 1471 0x00000000818d03c8 dead sun/reflect/DelegatingClassLoader@0x0000000100009df8
0x0000000082a9e0c8 1 1474 0x00000000818d03c8 dead sun/reflect/DelegatingClassLoader@0x0000000100009df8
0x0000000081bca7d8 1 880 0x00000000818d03c8 dead sun/reflect/DelegatingClassLoader@0x0000000100009df8
0x00000000827cf618 1 880 0x00000000818d03c8 dead sun/reflect/DelegatingClassLoader@0x0000000100009df8
0x0000000083152070 1 1474 0x00000000818d03c8 dead sun/reflect/DelegatingClassLoader@0x0000000100009df8
0x0000000081bcad50 1 880 0x00000000818d03c8 dead sun/reflect/DelegatingClassLoader@0x0000000100009df8
0x0000000083151af8 1 880 0x00000000818d03c8 dead sun/reflect/DelegatingClassLoader@0x0000000100009df8
0x0000000082a9e258 1 880 0x00000000818d03c8 dead sun/reflect/DelegatingClassLoader@0x0000000100009df8
0x0000000081bca648 1 880 0x00000000818d03c8 dead sun/reflect/DelegatingClassLoader@0x0000000100009df8
0x0000000081e5f990 1 1505 null dead sun/reflect/DelegatingClassLoader@0x0000000100009df8
0x0000000083151ee0 1 880 0x00000000818d03c8 dead sun/reflect/DelegatingClassLoader@0x0000000100009df8
0x00000000831e51e8 1 894 null dead sun/reflect/DelegatingClassLoader@0x0000000100009df8
0x0000000081bcabc0 1 880 0x00000000818d03c8 dead sun/reflect/DelegatingClassLoader@0x0000000100009df8
0x00000000827cfa00 1 881 null dead sun/reflect/DelegatingClassLoader@0x0000000100009df8
0x0000000083151968 1 1473 0x00000000818d03c8 dead sun/reflect/DelegatingClassLoader@0x0000000100009df8

total = 70 11227 19067595 N/A alive=7, dead=63 N/A

-F

强制模式。如果指定的pid没有响应,请使用jmap -dump或jmap -histo选项。此模式下,不支持live子选项。

jhat

jhat(JVM Heap Analysis Tool)命令是与jmap搭配使用,用来分析jmap生成的dump,jhat内置了一个微型的HTTP/HTML服务器,生成dump的分析结果后,可以在浏览器中查看。在此要注意,一般不会直接在服务器上进行分析,因为jhat是一个耗时并且耗费硬件资源的过程,一般把服务器生成的dump文件复制到本地或其他机器上进行分析。

  • 命令格式

jhat [dumpfile]

  • 参数

    • -stack false|true 关闭对象分配调用栈跟踪(tracking object allocation call stack)。 如果分配位置信息在堆转储中不可用. 则必须将此标志设置为 false. 默认值为 true.>
    • -refs false|true 关闭对象引用跟踪(tracking of references to objects)。 默认值为 true. 默认情况下, 返回的指针是指向其他特定对象的对象,如反向链接或输入引用(referrers or incoming references), 会统计/计算堆中的所有对象。>
    • -port port-number 设置 jhat HTTP server 的端口号. 默认值 7000.>
    • -exclude exclude-file 指定对象查询时需要排除的数据成员列表文件(a file that lists data members that should be excluded from the reachable objects query)。 例如, 如果文件列列出了 java.lang.String.value , 那么当从某个特定对象 Object o 计算可达的对象列表时, 引用路径涉及 java.lang.String.value 的都会被排除。>
    • -baseline exclude-file 指定一个基准堆转储(baseline heap dump)。 在两个 heap dumps 中有相同 object ID 的对象会被标记为不是新的(marked as not being new). 其他对象被标记为新的(new). 在比较两个不同的堆转储时很有用.>
    • -debug int 设置 debug 级别. 0 表示不输出调试信息。 值越大则表示输出更详细的 debug 信息.>
    • -version 启动后只显示版本信息就退出>
    • -J< flag > 因为 jhat 命令实际上会启动一个JVM来执行, 通过 -J 可以在启动JVM时传入一些启动参数. 例如, -J-Xmx512m 则指定运行 jhat 的Java虚拟机使用的最大堆内存为 512 MB. 如果需要使用多个JVM启动参数,则传入多个 -Jxxxxxx.
  • 示例

1
2
3
4
5
6
7
8
9
10
λ jhat -J-Xmx512m dump.hprof
Reading from dump.hprof...
Dump file created Sat Sep 29 16:43:48 CST 2018
Snapshot read, resolving...
Resolving 1639269 objects...
Chasing references, expect 327 dots.......................................................................................................................................................................................................................................................................................................................................
Eliminating duplicate references.......................................................................................................................................................................................................................................................................................................................................
Snapshot resolved.
Started HTTP server on port 7000
Server is ready.

中间的-J-Xmx512m是在dump快照很大的情况下分配512M内存去启动HTTP服务器,运行完之后就可在浏览器打开Http://localhost:7000进行快照分析 堆快照分析主要在最后面的Heap Histogram里,里面根据class列出了dump的时候所有存活对象。

分析同样一个dump快照,MAT需要的额外内存比jhat要小的多的多,所以建议使用MAT来进行分析,当然也看个人偏好。

  • 分析

打开浏览器Http://localhost:7000,该页面提供了几个查询功能可供使用:

1
2
3
4
5
6
7
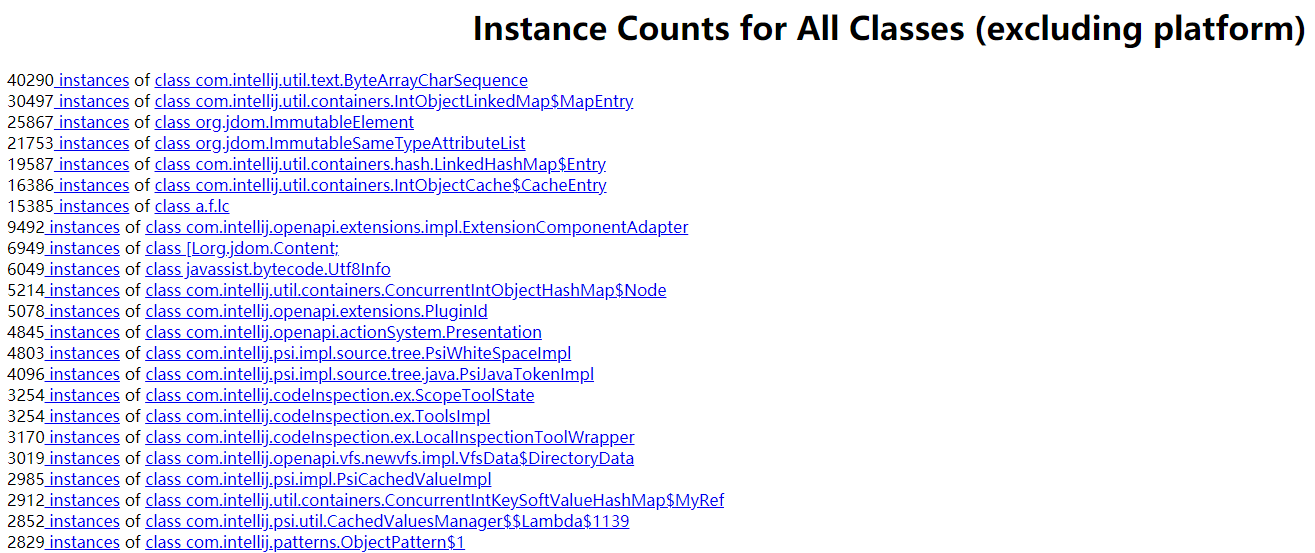
All classes including platform
Show all members of the rootset
Show instance counts for all classes (including platform)
Show instance counts for all classes (excluding platform)
Show heap histogram
Show finalizer summary
Execute Object Query Language (OQL) query

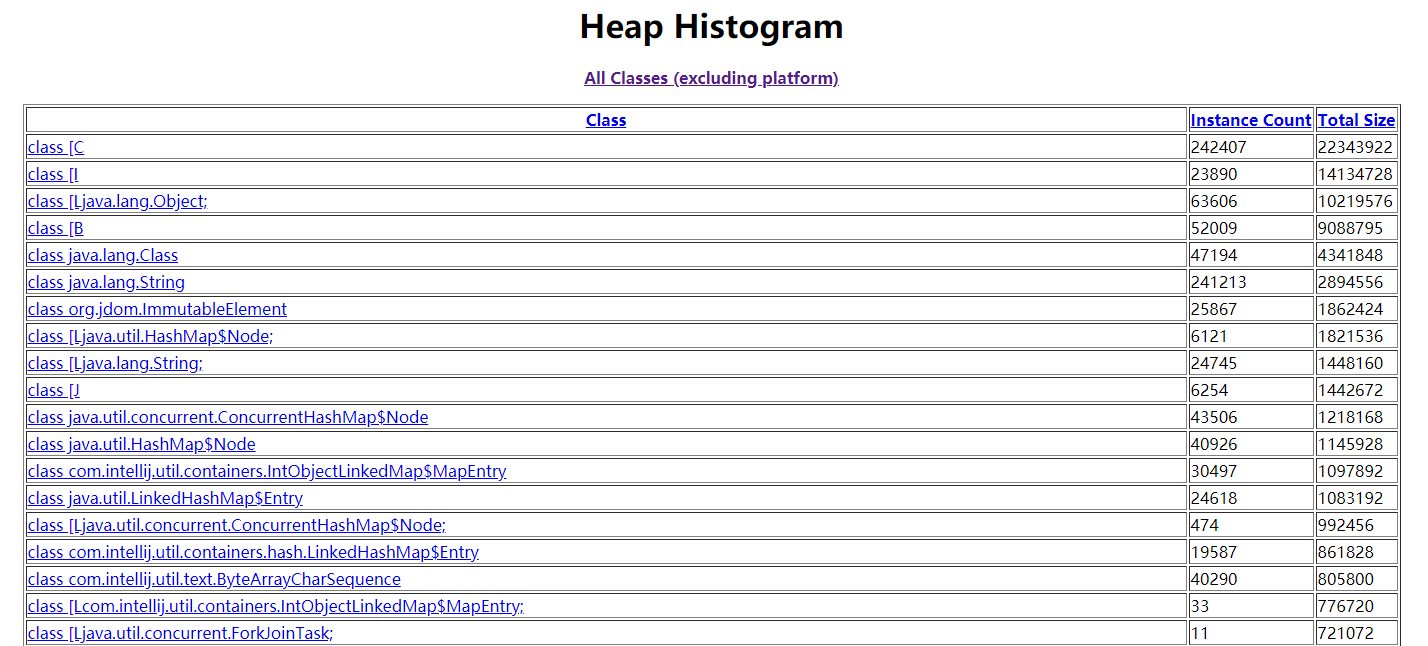
一般查看堆异常情况主要看这个两个部分: Show instance counts for all classes (excluding platform),平台外的所有对象信息。如下图:

instance-counts-excluding-platform

Show heap histogram 以树状图形式展示堆情况。如下图:

heap-histogram.png

具体排查时需要结合代码,观察是否大量应该被回收的对象在一直被引用或者是否有占用内存特别大的对象无法被回收。

一般情况,会down到客户端用工具来分析

jstack

jstack用于生成java虚拟机当前时刻的线程快照。线程快照是当前java虚拟机内每一条线程正在执行的方法堆栈的集合,生成线程快照的主要目的是定位线程出现长时间停顿的原因,如线程间死锁、死循环、请求外部资源导致的长时间等待等。 线程出现停顿的时候通过jstack来查看各个线程的调用堆栈,就可以知道没有响应的线程到底在后台做什么事情,或者等待什么资源。 如果java程序崩溃生成core文件,jstack工具可以用来获得core文件的java stack和native stack的信息,从而可以轻松地知道java程序是如何崩溃和在程序何处发生问题。另外,jstack工具还可以附属到正在运行的java程序中,看到当时运行的java程序的java stack和native stack的信息, 如果现在运行的java程序呈现hung的状态,jstack是非常有用的。

  • 命令格式

jstack [option] LVMID

  • option参数

    • -F : 当正常输出请求不被响应时,强制输出线程堆栈
    • -l : 除堆栈外,显示关于锁的附加信息
    • -m : 如果调用到本地方法的话,可以显示C/C++的堆栈
  • 示例

1
2
3
4
5
6
7
8
9
10
11
12
13
14
15
16
17
18
19
20
21
22
23
24
25
26
27
28
29
30
31
32
33
34
35
36
37
38
39
40
41
42
43
44
λ jstack -l 7924 | more
2018-09-29 18:04:49
Full thread dump Java HotSpot(TM) 64-Bit Server VM (25.131-b11 mixed mode):

"XNIO-2 task-32" #94 prio=5 os_prio=0 tid=0x000000001ea48000 nid=0x710 waiting on condition [0x0000000022a5e000]
java.lang.Thread.State: WAITING (parking)
at sun.misc.Unsafe.park(Native Method)
- parking to wait for <0x0000000083097410> (a java.util.concurrent.locks.AbstractQueuedSynchronizer$ConditionObject)
at java.util.concurrent.locks.LockSupport.park(LockSupport.java:175)
at java.util.concurrent.locks.AbstractQueuedSynchronizer$ConditionObject.await(AbstractQueuedSynchronizer.java:2039)
at java.util.concurrent.LinkedBlockingQueue.take(LinkedBlockingQueue.java:442)
at java.util.concurrent.ThreadPoolExecutor.getTask(ThreadPoolExecutor.java:1067)
at java.util.concurrent.ThreadPoolExecutor.runWorker(ThreadPoolExecutor.java:1127)
at java.util.concurrent.ThreadPoolExecutor$Worker.run(ThreadPoolExecutor.java:617)
at java.lang.Thread.run(Thread.java:748)

Locked ownable synchronizers:
- None

"XNIO-2 task-31" #93 prio=5 os_prio=0 tid=0x000000001ea4e800 nid=0x3840 waiting on condition [0x000000002295e000]
java.lang.Thread.State: WAITING (parking)
at sun.misc.Unsafe.park(Native Method)
- parking to wait for <0x0000000083097410> (a java.util.concurrent.locks.AbstractQueuedSynchronizer$ConditionObject)
at java.util.concurrent.locks.LockSupport.park(LockSupport.java:175)
at java.util.concurrent.locks.AbstractQueuedSynchronizer$ConditionObject.await(AbstractQueuedSynchronizer.java:2039)
at java.util.concurrent.LinkedBlockingQueue.take(LinkedBlockingQueue.java:442)
at java.util.concurrent.ThreadPoolExecutor.getTask(ThreadPoolExecutor.java:1067)
at java.util.concurrent.ThreadPoolExecutor.runWorker(ThreadPoolExecutor.java:1127)
at java.util.concurrent.ThreadPoolExecutor$Worker.run(ThreadPoolExecutor.java:617)
at java.lang.Thread.run(Thread.java:748)

Locked ownable synchronizers:
- None

"XNIO-2 task-30" #92 prio=5 os_prio=0 tid=0x000000001ea4e000 nid=0x1c54 waiting on condition [0x000000002285f000]
java.lang.Thread.State: WAITING (parking)
at sun.misc.Unsafe.park(Native Method)
- parking to wait for <0x0000000083097410> (a java.util.concurrent.locks.AbstractQueuedSynchronizer$ConditionObject)
at java.util.concurrent.locks.LockSupport.park(LockSupport.java:175)
at java.util.concurrent.locks.AbstractQueuedSynchronizer$ConditionObject.await(AbstractQueuedSynchronizer.java:2039)
at java.util.concurrent.LinkedBlockingQueue.take(LinkedBlockingQueue.java:442)
at java.util.concurrent.ThreadPoolExecutor.getTask(ThreadPoolExecutor.java:1067)
at java.util.concurrent.ThreadPoolExecutor.runWorker(ThreadPoolExecutor.java:1127)
-- More --

jinfo

jinfo(JVM Configuration info)这个命令作用是实时查看和调整虚拟机运行参数。 之前的jps -v口令只能查看到显示指定的参数,如果想要查看未被显示指定的参数的值就要使用jinfo口令

  • 命令格式

jinfo [option] [args] LVMID

  • option参数

    • -flag : 输出指定args参数的值
    • -flags : 不需要args参数,输出所有JVM参数的值
    • -sysprops : 输出系统属性,等同于System.getProperties()
  • 示例

1
2
3
4
5
6
7
λ jinfo -flags 7924
Attaching to process ID 7924, please wait...
Debugger attached successfully.
Server compiler detected.
JVM version is 25.131-b11
Non-default VM flags: -XX:-BytecodeVerificationLocal -XX:-BytecodeVerificationRemote -XX:CICompilerCount=3 -XX:InitialHeapSize=134217728 -XX:+ManagementServer -XX:MaxHeapSize=2122317824 -XX:MaxNewSize=707264512 -XX:MinHeapDeltaBytes=524288 -XX:NewSize=44564480 -XX:OldSize=89653248 -XX:TieredStopAtLevel=1 -XX:+UseCompressedClassPointers -XX:+UseCompressedOops -XX:+UseFastUnorderedTimeStamps -XX:-UseLargePagesIndividualAllocation -XX:+UseParallelGC
Command line: -XX:TieredStopAtLevel=1 -Xverify:none -Dspring.output.ansi.enabled=always -Dcom.sun.management.jmxremote -Dcom.sun.management.jmxremote.port=58045 -Dcom.sun.management.jmxremote.authenticate=false -Dcom.sun.management.jmxremote.ssl=false -Djava.rmi.server.hostname=localhost -Dspring.liveBeansView.mbeanDomain -Dspring.application.admin.enabled=true -javaagent:D:\JetBrains\apps\IDEA-U\ch-0\182.4323.46\lib\idea_rt.jar=58046:D:\JetBrains\apps\IDEA-U\ch-0\182.4323.46\bin -Dfile.encoding=UTF-8